This blog post first appeared on the City of Vancouver’s SAP intranet in 2011, and it was written in order to facilitate understanding among its employees regarding this up and coming field.
First off, what is an “infographic”?
People still ask me this question and for good reason: although the concept has been around since the first humans started drawing representations of their surroundings on the walls of caves, the term however is still widely unknown, with most people spelling it as two words – ‘info” & “graphic”. Other terms that have emerged lately, only add further to the confusion: diagraphics, videographics, etc. So, to put it simply – an infographic is a visual representation of information, data or knowledge.
The main goal of an infographic is to communicate information in a clear and effective manner, while engaging the viewer with visual elements that transform the act of reading a page into a whole new experience. Infographics can be used to display step-by-step processes, signs, manuals, presentations, maps, worksheets, statistics, reports, tracking tools.
The traditional way of presenting information is by writing a document (or a web page) and let the audience interpret it – hopefully in the manner intended by the author. People – however – are very visual by nature and would much rather see a sketch of a process then reading a very lengthy (and sometimes very technical) block of text. Think about it – the earliest forms of written expression began as pictographs and hieroglyphs.
Infographics can be presented by themselves – hence replacing a whole page, or in conjunction with an article (in which case it helps to further emphasize the information on that page). In some instances, more than one page can be replaced by an intuitive infographic, which saves the content strategist assigned with rewriting those pages a lot of time and saves the user from having to read through all the lengthy paragraphs.
Another aspect to keep in mind is that many of our site users do not have English as their first language. Some visit the City website even before they move to Canada, using it to decide if Vancouver will be the right choice for them. Others use it after they already established here, in search for information that is vital to their quick and smooth integration in the society. For these residents, following a page written even in the most basic English language can sometimes be a challenge. They can overlook important information or misunderstand certain facts. An simple infographic proves to be the most effective way of displaying all sorts of information and data in this case.
Each day, more and more companies realize the potential of this discipline and make it an integral part of their online presence, which proves to be very beneficial to all parties involved, as it greatly improves the user-experience and therefore gets the message across more effectively.
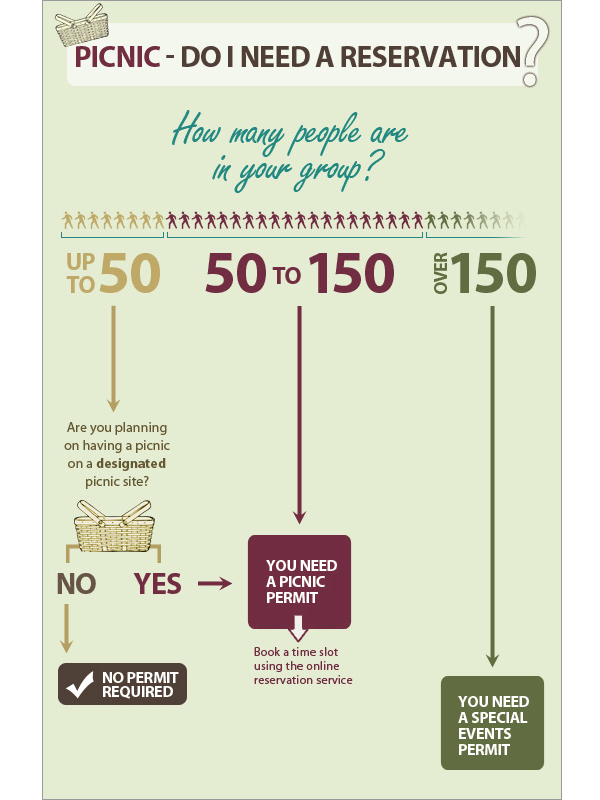
Without further due, please view the example below, which is a simple approach to an otherwise tedious process of understanding how to get a picnic permit.